The 12-Number HVAC Scorecard Every Owner Should Review Monday
An HVAC dashboard can show hundreds of numbers and still leave the owner guessing.
Calls, leads, bookings, estimates, revenue, membership sales, callbacks, reviews, overtime, gross margin, campaign spend, and install backlog all matter. The weekly scorecard has a different job. It should show the few numbers that reveal where demand enters, where it leaks, what the team sells, whether operations can deliver, and whether the economics remain healthy.
The Scale Your Offers operating system uses sixteen stages across marketing, sales, operations, and business structure, then recommends a smaller weekly set with deeper monthly review.[1]
This article gives you a practical 12-number HVAC KPI scorecard and the rules for using it.
The scorecard should follow the customer journey
Read the company in the order work happens:
- Demand reaches the business.
- The office turns demand into appointments.
- Technicians create and identify opportunities.
- Sales turns opportunities into signed work.
- Operations delivers the work.
- The customer returns, refers, and reviews.
- Marketing and finance close the loop.
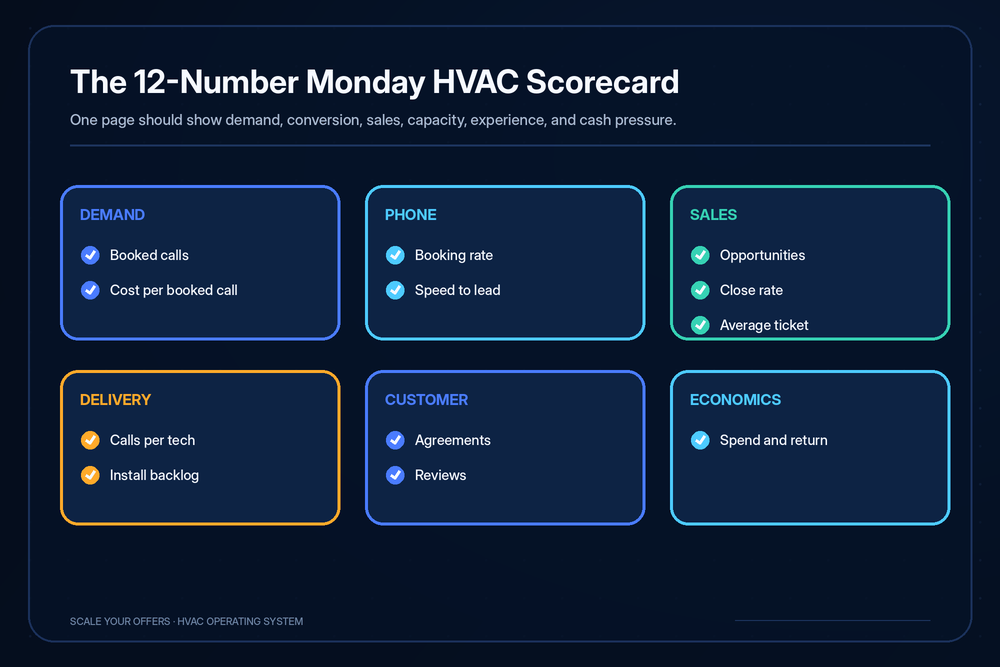
A scorecard organized this way helps leadership diagnose the earliest weak stage instead of reacting to the loudest symptom.
Number 1: booked calls
Definition: Confirmed service and replacement appointments placed on the calendar during the week.
Track service and replacement separately. A maintenance tune-up, no-cool service call, and replacement consultation create different capacity and revenue paths.
Questions:
- Did volume change by source, day, or call type?
- Did weather or season explain the movement?
- Does available technician and install capacity support the calendar?
Number 2: booking rate on answered qualified calls
Formula:
Booked qualified calls ÷ answered qualified inbound calls
Define “qualified” in writing: service area, work type, decision authority where relevant, timing, and other business rules.
Do not hide booking problems inside lead-quality complaints. Review recorded calls, the ask for the appointment, arrival windows, fees, and common lost reasons.
Number 3: speed to first human response
Track median time and the share of leads contacted inside your company standard. Separate business hours, after-hours, calls, forms, and paid-social leads.
Automation can acknowledge a request. Human contact is the operating result.
For a deeper response workflow, link to Speed to Lead: What a 5-Minute Response Does to Close Rate.
Number 4: cost per booked call or job by channel
Formula:
Channel spend ÷ booked appointments attributed to the channel
A cheap lead can become an expensive booked call. Track through the appointment and, when systems allow, through sold and collected revenue.
Use separate views for Google, paid social, Local Services Ads, database reactivation, referrals, organic search, and other meaningful sources.
Number 5: calls run per technician per day
This is a capacity and schedule-quality measure. Read it with:
- Call type and complexity.
- Geography and drive time.
- Technician experience.
- Maintenance versus demand service.
- Callback and warranty work.
- Overtime.
A higher number is not automatically better. The purpose is to see whether demand, staffing, routing, and quality are aligned.
Number 6: average service ticket
Formula:
Service revenue ÷ completed revenue-producing service calls
Read average ticket with call mix, agreement discounts, warranty work, geography, and technician opportunity. A rising average can indicate better diagnosis and options. It can also reflect a week with more expensive failures.
Review distribution, not only the average. Compare similar call types and technicians carefully.
Number 7: replacement opportunities generated
Define what qualifies. Examples may include:
- A dedicated replacement appointment.
- A technician-generated lead that meets age, repair, comfort, safety, or customer-intent criteria.
- An unsold estimate reactivated into a new appointment.
Track the source: marketing, service technician, maintenance customer, referral, database, or other.
Number 8: replacement close rate
Formula:
Signed replacement jobs ÷ qualified replacement opportunities presented
Define when an opportunity enters and when it is lost. Separate same-day close rate from eventual close rate. Track open estimates by age and next action.
The 2025 ACCA Contractor of the Future study reported that contractors presenting four or more proposal options saw close rates increase 10% compared with those using a traditional three-option approach. It also reported an 11% close-rate increase when financing was offered.[2] Those are study findings, not a guarantee. Use them to examine your proposal and financing processes.
Number 9: average replacement ticket
Formula:
Signed replacement revenue ÷ signed replacement jobs
Read it with equipment mix, scope, ductwork, accessories, warranties, rebates, discounts, sales rep, financing, and gross margin.
A higher ticket with falling margin or increasing callbacks is not automatically improvement.
Number 10: new and retained maintenance agreements
Track at least:
- New agreements sold.
- Renewal rate.
- Cancellations.
- Failed payments.
- Tune-ups due.
- Agreement customers converting to repairs and replacements.
The weekly scorecard may use new agreements and exceptions. The monthly review should inspect the entire agreement base.
Number 11: reviews collected and callback rate
These are separate numbers that belong in the customer-experience view.
Review collection rate:
New public reviews ÷ eligible completed jobs where the approved request was made
Callback rate:
Qualifying callbacks ÷ completed jobs
Define a callback carefully. Separate workmanship, diagnosis, equipment failure, customer education, warranty, scheduling, and unrelated new issues. The point is to learn, not manipulate classification.
Number 12: install backlog, marketing spend, and attributed return
The Scale Your Offers weekly set includes install backlog in days and marketing spend/return as separate numbers.[1] Many owners can keep 12 rows by combining these in a final economics and capacity panel, while preserving both values.
Track:
- Sold install days waiting.
- Available crew days.
- Material or permit constraints.
- Marketing spend.
- Sold revenue by source.
- Collected revenue and gross margin when available.
A rising backlog can mean strong sales and insufficient capacity. Continuing to raise demand may create delays, overtime, cancellations, and customer damage.
For breakeven math, link to Good ROAS for Contractors: Breakeven by Gross Margin.
Use the earliest-constraint rule
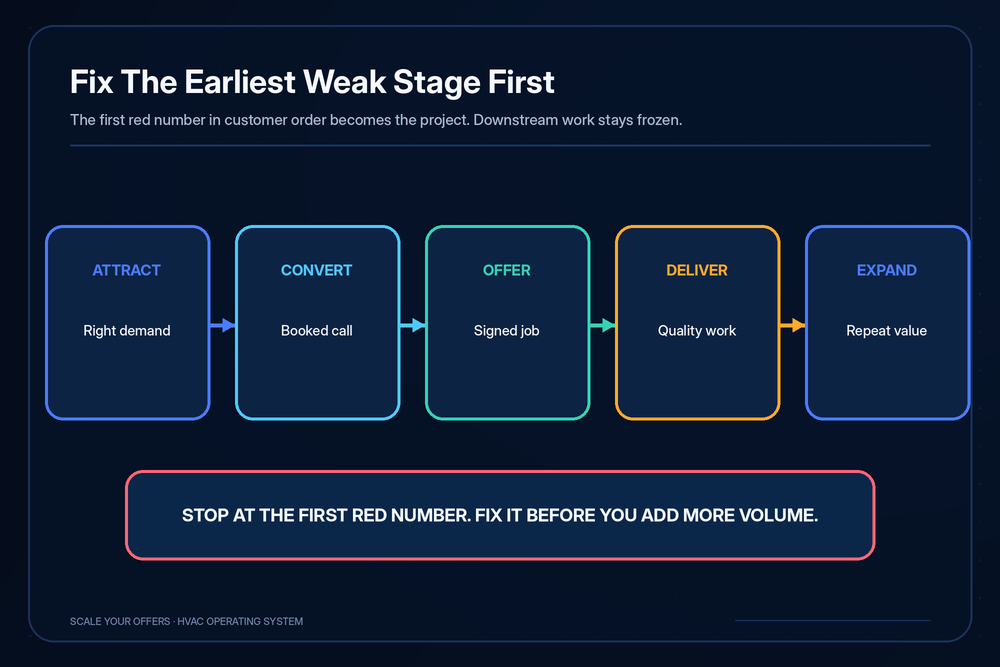
Walk the scorecard in order. Stop at the first materially weak stage.
Examples:
- Booked calls are low because qualified demand is low: inspect the offer, sources, market, and season.
- Qualified calls are healthy and booking rate is low: repair the phone process before buying more leads.
- Bookings are strong and replacement opportunities are low: inspect call mix, diagnosis, maintenance base, and technician handoff.
- Opportunities are strong and close rate is low: inspect sales process, decision-maker attendance, options, financing, and follow-up.
- Sales are strong and backlog is too high: align demand with install capacity before adding volume.
This rule prevents the company from spending downstream of a leak.
Define every number before using it
Create a metric dictionary.
| Field | Example |
|---|---|
| Metric name | Booking rate on answered qualified calls |
| Formula | Booked qualified calls ÷ answered qualified calls |
| Inclusion | Calls in service area for work the company performs |
| Exclusion | Spam, vendors, existing appointment changes |
| Data source | Call system and CRM |
| Owner | CSR manager |
| Update time | Monday 7:00 a.m. |
| Target | Company target |
| Red threshold | Company-defined |
Without definitions, departments bring different numbers to the same meeting.
Use targets, trends, and confidence
Every row should show:
- Target.
- Actual.
- Prior week.
- Four-week average.
- Owner.
- Status.
- Data confidence.
A single week may move because of weather, holidays, call mix, large jobs, or data errors. The weekly number starts investigation. The trend helps leadership judge whether the system changed.
An illustrative scorecard
| Metric | Target | Actual | Four-week avg. | Owner | Status |
|---|---|---|---|---|---|
| Booked calls | 110 | 96 | 101 | CSR manager | Red |
| Booking rate | 68% | 54% | 58% | CSR manager | Red |
| Speed to human response | Company standard | Missed | Mixed | CSR manager | Red |
| Cost per booked call | $350 | $372 | $361 | Marketing owner | Yellow |
| Calls per tech/day | 4.0 | 4.1 | 3.9 | Service manager | Green |
| Avg. service ticket | $475 | $498 | $486 | Service manager | Green |
| Replacement opportunities | 20 | 18 | 19 | Service manager | Yellow |
| Replacement close rate | 50% | 56% | 51% | Sales manager | Green |
| Avg. replacement ticket | $12,000 | $12,400 | $12,150 | Sales manager | Green |
| New agreements | 24 | 19 | 21 | Service manager | Yellow |
| Reviews / callbacks | 18 / < target | 10 / above target | Mixed | CX owner | Red |
| Backlog / spend / return | 7 days / plan | 15 days / above plan | Capacity tight | Ops + marketing | Red |
Every figure is illustrative. Replace targets with your own economics, season, market, and quality standard.
The first red stage in this example is booking. Leadership should investigate answered calls, scheduling offers, staffing, response, and call quality before increasing paid lead volume. The backlog also needs an immediate capacity decision, but it does not erase the earlier leak.
Connect weekly KPIs to monthly financials
Weekly metrics are leading and operating indicators. The monthly review should reconcile them with:
- Revenue by department.
- Gross margin by work type.
- Labor efficiency.
- Overhead.
- Net profit.
- Cash and receivables.
- Financing and merchant fees.
- Callback and warranty cost.
- Marketing spend and attributed gross profit.
The scorecard can look green while the P&L deteriorates if definitions, margin, or cost allocation are wrong. Finance closes the loop.
Avoid KPI gaming
Any metric can create bad behavior when leadership rewards the number without the standard.
- Booking rate can rise by accepting poor-fit calls.
- Calls per technician can rise while diagnosis and customer care fall.
- Average ticket can rise while trust and margin quality fall.
- Close rate can rise through excessive discounts.
- Callback rate can “improve” when employees stop reporting.
- Review count can rise through policy-violating or selective practices.
Pair outcome numbers with process audits and customer/quality evidence.
Use the scorecard in a 60-minute meeting
- Read all numbers in 10 minutes.
- Mark red or unclear rows.
- Choose the top three issues.
- Separate facts from assumptions.
- Decide the next action or test.
- Assign one owner and due date.
- Confirm whether demand, staffing, or budget must change now.
OSHA's program-evaluation guidance recommends establishing and tracking performance indicators, involving workers, and identifying opportunities to improve.[3] Use qualified safety systems for safety performance. The operating discipline applies broadly: numbers should lead to evaluation and corrective action.
A 30-day HVAC scorecard rollout
Week 1: define
Choose the metrics, formulas, inclusion rules, data sources, and owners.
Week 2: baseline
Pull eight to thirteen weeks of history where possible. Mark data confidence and clean the largest gaps.
Week 3: run
Hold the first Monday scorecard meeting. Do not redesign the scorecard during every discussion.
Week 4: refine
Remove vanity metrics, split misleading averages, fix data ownership, and connect the scorecard to the monthly P&L review.
HVAC KPI scorecard checklist
- The scorecard follows the customer journey.
- Twelve or fewer weekly rows create focus.
- Service and replacement are separated where needed.
- Every metric has a written formula.
- Every metric has one owner.
- Every metric has one primary data source.
- Targets come from company economics and capacity.
- Trends appear beside the current week.
- Data confidence is visible.
- The team fixes the earliest weak stage first.
- Process audits protect against gaming.
- Monthly financials reconcile the operating story.
- Decisions leave the meeting with names and dates.
FAQ
What KPIs should an HVAC company track?
Track demand, booking, response, cost per booked call, technician capacity, service ticket, replacement opportunities, close rate, replacement ticket, agreements, customer experience, install backlog, and marketing economics. Use deeper department dashboards for additional detail.
How many KPIs belong on a weekly HVAC scorecard?
Use the smallest set that reveals the operating path. Twelve is a practical starting point. Review detailed financial, safety, people, and department metrics monthly or in the appropriate specialist cadence.
What is the most important HVAC KPI?
There is no single universal metric. The most useful number is the earliest weak stage in the current customer journey. A close-rate problem matters less when qualified opportunities are not entering the calendar.
Who owns the scorecard?
The operating leader owns the meeting. Each metric has one accountable seat responsible for reporting, understanding movement, and leading the response.
Should technicians see the company scorecard?
Share the numbers and context relevant to their work. Department scorecards can translate company goals into clear field expectations without exposing confidential information unnecessarily.
See the leak before the month ends
A Monday scorecard turns the company from reaction to diagnosis. The next step is scoring the full growth path.
Take the free A.C.E. Assessment to see whether Attract, Convert, or Expand is costing the company the most jobs right now.
References
- Scale Your Offers, The Booked-Out Operating System and The Booked-Out Business Playbook: HVAC Edition, scorecard and execution sections.
- ACCA, Inside the Contractor of the Future Study: Key Findings From 1,000+ Contractors
- OSHA, Safety Management: Program Evaluation and Improvement